
You are what you measure.
This is especially true for SaaS businesses. Our goals and endeavors center on user growth, delivering consistent value, and profitability. This again depends on the efficiency with which customers can be earned, and nurtured.
All this begs a question: how do you know and measure the most crucial KPIs to achieve said goals?
Well, I know this is subjective. Because it depends on where you stand and where your focus lies at any given point in time.
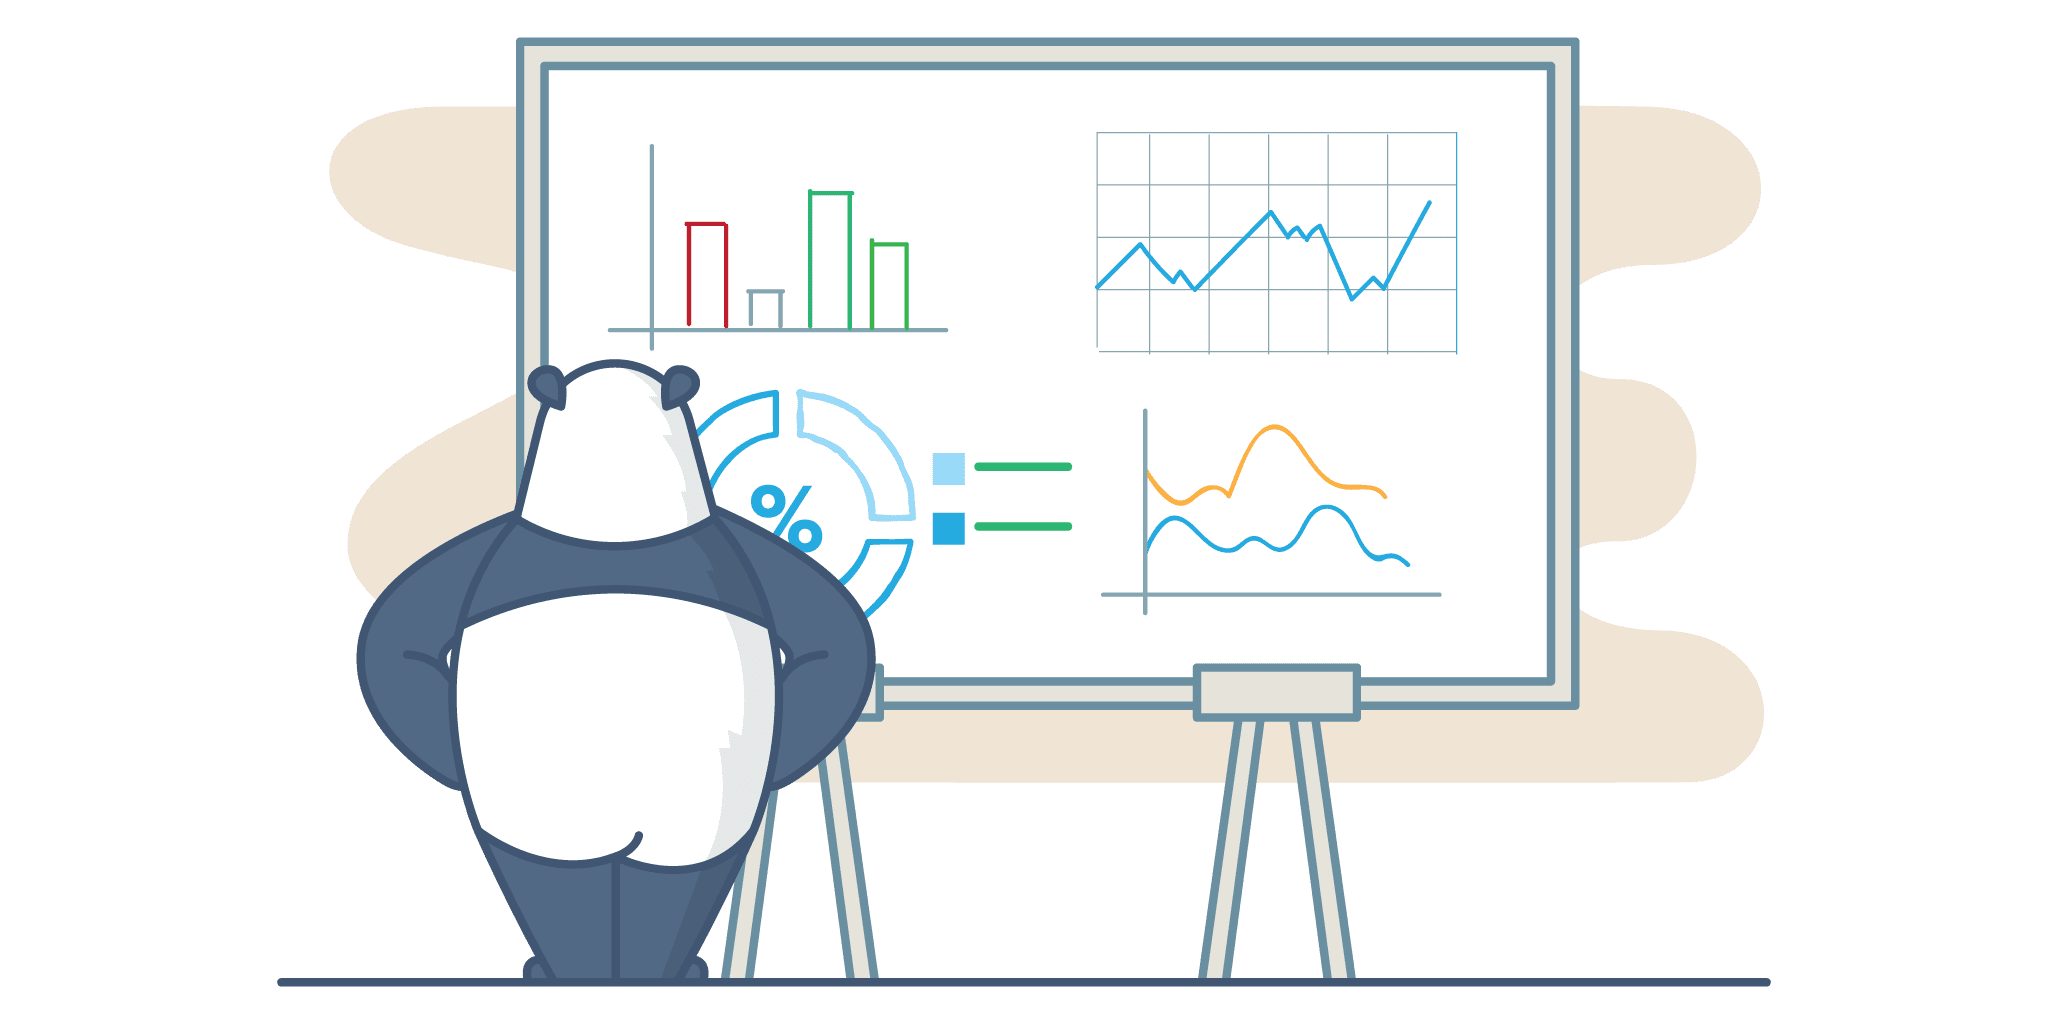
That being said, Google Analytics comes in handy no matter where you are as a company. And that’s precisely what we’ve set out to explore with the help of Dave McClure’s AARRR framework in an in-depth slide deck.
If you are at the helm of a small to medium sized business, Google Analytics just works, as it is a free/standard analytics tool that is easy to configure and maintain.
Although, when I was introduced to Google Analytics, I found it to be quite irksome to grasp for the following reasons:
1) There is a lot of generic material about Google Analytics on the internet, and its scope of use for a SaaS application is difficult to pin down.
2) Lack of actionable resources (what I really required wasn’t just a frame to understand the tool, but real lessons that I could put to test at my end).
Hence, with that in mind, I’ve put together a deck with things that I’ve learned over the last few months, that’ll (hopefully) give beginners a broad perspective on the use of Google Analytics for a SaaS business, and at the same time provide some actionables to get started.
Now, let’s dive into the deck.